Addressing the Roadway Safety Crisis: Building Safer Roads for All
Testimony to U.S. House Committee on Transportation and Infrastructure, Subcommittee on Highways and Transit
June 08, 2022 | Washington, D.C.
Testimony to U.S. House Committee on Transportation and Infrastructure, Subcommittee on Highways and Transit
June 08, 2022 | Washington, D.C.
For a printer-friendly copy
Chair Defazio, Chair Norton, Ranking Member Graves, Ranking Member Davis and members of the Subcommittee, thank you for allowing the National Safety Council (NSC) to share these comments for the record.
NSC is America’s leading nonprofit safety advocate and has been for more than 100 years. As a mission-based organization, we work to eliminate the leading causes of preventable death and injury, focusing our efforts on the workplace, roadway and impairment. We create a culture of safety to not only keep people safer at work, but also beyond the workplace so they can live their fullest lives. Our more than 13,000 member companies and federal agencies represent employees at nearly 41,000 U.S. worksites.
In short: our roads have become more deadly since 2020.
Early estimates from the National Highway Traffic Safety Administration project 42,915 people were killed in motor vehicle incidents in 2021. We believe these crashes, which have a tremendous human toll and cost the American economy more than $ 473.2 billion a year, are entirely preventable. We know what is killing people and, more importantly, we have the tools, strategies, and resources to begin saving lives today.
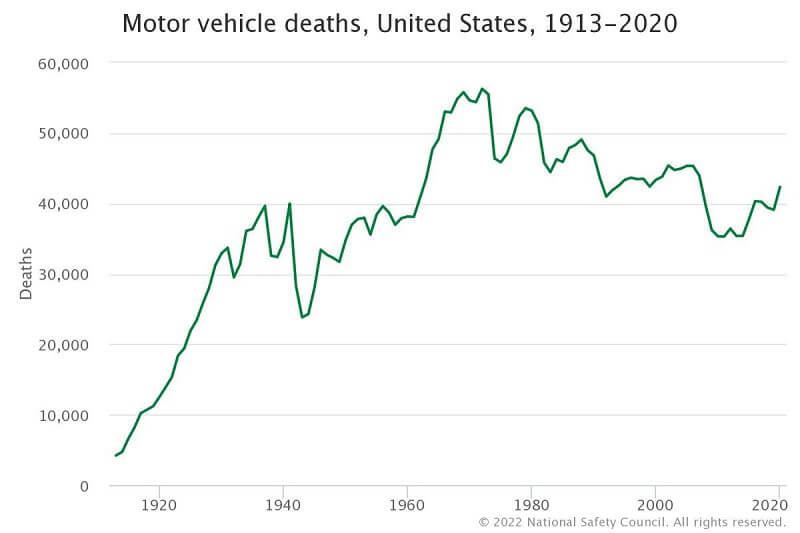
Chart shows total motor vehicle data, source NSC estimates and National Center for Health Statistics
Included below are the number of people killed in motor vehicle crashes in the Chairs’ and Ranking Members’ states for 2021, as well as the year-over-year percentage increase from 2020 preliminary estimates. This trend is being seen in states across the United States and needs immediate and decisive action.
● Oregon: 588 deaths (20% increase from 2020)
● Washington, DC: 39 deaths (8% increase from 2020)
● Missouri: 1,014 deaths (3% increase from 2020)
● Illinois: 1,324 deaths (18% increase from 2020)
These are the lives of your constituents. More so, these were family members, friends, neighbors, and colleagues who contributed to the communities in which they lived and were taken from their loved ones much too soon. Where is the outrage over the loss felt from each of these deaths? It is conspicuously absent, particularly when compared to deaths in other forms of transportation, such as aviation.
We know where we need to focus our attention, research, and action to stop the growing number of roadway fatalities. I want to highlight a few strategies and considerations that can help inform our approach to saving lives.
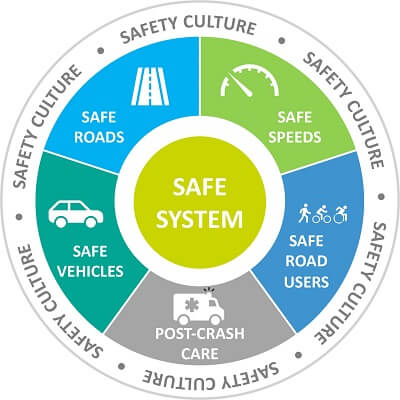
Safe System Approach
We took a step in the right direction last year with the passage and signing of the Infrastructure Investment and Jobs Act (IIJA), which included the Safe System approach. The IIJA defines the Safe System approach that emphasizes minimizing the risk of injury or fatality to road users and takes into consideration the possibility and likelihood of human error and the impact on vulnerable road users. The Safe System approach aims to eliminate fatal and serious injuries for all road users through a comprehensive approach. Its inclusion in IIJA demonstrated a commitment at a national level for this much-needed shift in traffic safety.
NSC has long supported this important approach to traffic safety, incorporating it as one of the strategic pillars of the Road to Zero strategy and work to advance its adoption. Through a Safe System approach, all of us, across sectors and backgrounds, commit to changing our nation’s safety culture to think about roadway crashes in a more holistic and systemic fashion. Fully adopted by other modes of transportation, a Safe System approach accepts the inevitability of human mistakes and creates fail-safe mechanisms in behavior, infrastructure, and vehicle design, among other things, to protect against death and serious injury.
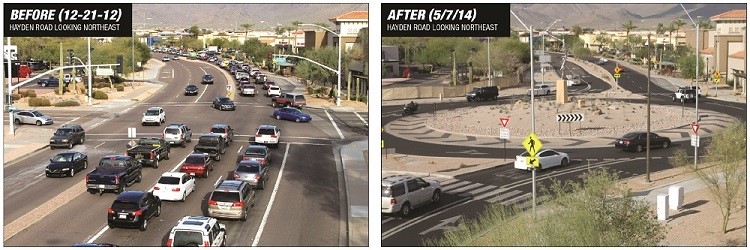
The IIJA established the framework for more widespread adoption by roadway planners and engineers. However, building a Safe System will take time, so we must get started. With the understanding people inevitably will make mistakes, the Safe System approach to infrastructure can be more forgiving than other infrastructure improvement efforts to eliminate fatalities. Some of these changes may include engineering greater safety into a design. For example, in the pictures below, a multi-lane intersection with a red light in Scottsdale, AZ was replaced with a roundabout. With the intersection, there are 32 potential points of failure but, with a roundabout, that is engineered down to only eight. Speeds are decreased, and if crashes do occur, they occur at less-violent angles. Crosswalk lengths are also reduced, lowering the amount of time pedestrians are exposed to cross-traffic.
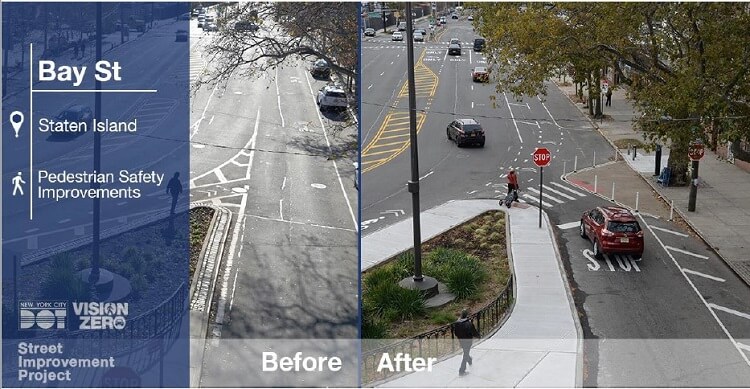
Successful infrastructure redesign can also look like the picture below from New York City. The picture on the left shows two roads merging without an area for pedestrians and the lane lines are non-existent. However, the reworked merge incorporates clearly marked lanes of travel, large sidewalks and areas for pedestrians with less exposure to vehicles.
These infrastructure changes are just as important in rural areas. Rumble strips on the center line or edge of roadways can prevent the roadway departure crashes accounting for 51% of roadway fatalities in the U.S. Cable median barriers can also provide a margin of safety to redirect people to their lane of travel and high-friction surface treatments can decrease vehicle stopping distance on roadways. These are all tools we have available today and can be encouraged through the implementation of the programs and funding authorized in recent legislation.
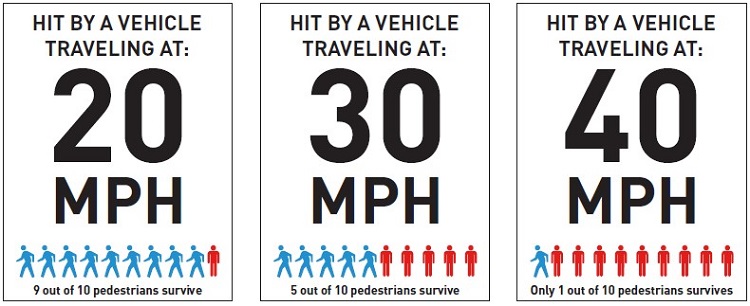
The Safe System approach has the potential to affect the persistent issue of speeding by setting context-appropriate speeds, which are then encouraged through comprehensive speed management. Excessive speed is a problem in this country. When speeding vehicles collide with pedestrians, cyclists and other vulnerable road users (VRU), the results are deadly. In 2020, more than 7,000 pedestrians were killed in traffic crashes in the U.S. Pedestrians are 1.5 times more likely than occupants of passenger vehicles to be killed in a car crash. From 2009 to 2018, the number of pedestrian fatalities increased by 53%. As of 2020, pedestrian fatalities are 16% of all traffic fatalities. As illustrated, at 20 miles per hour (mph), 9 out of 10 pedestrians would survive being struck by a vehicle, while 9 out of 10 pedestrians would be killed at double that speed (at 40 mph).
The data bear out the same case for vehicle crashes involving speed. The Insurance Institute for Highway Safety (IIHS) estimated increasing speed limits over the past 25 years have led to 37,000 additional deaths, and 29% of all crash fatalities in 2020 occurred in speed-related crashes. IIHS collaborated with the AAA Foundation for Traffic Safety to conduct high-speed crash tests, which demonstrated that higher speeds cancel out the safety benefits of improved vehicle design. For example, during a test crash at 40 mph, the driver’s space was minimally impacted. At 50 mph, the impact to the driver’s space was much more pronounced. At 56 mph, the interior of the vehicle was significantly compromised, most likely leading to significant injuries to the driver and occupants.
NSC recommends the following actions to address speeding:
● Expand the scope of factors used to determine speeds, such as crash history and roadway design, and de-emphasize the 85th percentile approach
● Expand the use of automated enforcement, ensuring it is done in a way that has safety as the priority and addresses equity concerns.
● Allow for local control over speed limits so they are context appropriate and determined by those with the best knowledge of the environment.
● Allow for local policymakers and engineers to deploy traffic calming interventions, perform road diets, and utilize the latest best practices in designing safe roads.
Allowing for flexibility to implement local safety measures is key to reflect local priorities. NSC encourages this Committee to explore options for cities, counties and metropolitan planning organizations to prioritize safety for their residents in the ways they know to work best. This may allow for lowering speed limits, instituting automated enforcement, improving data collection, accessing safety funds and other items. Local decision-makers often have better data and information directly from community members about areas in severe need of transportation improvements and should be encouraged to address disparities they see within their crash data.
USDOT must provide information and resources to cities, counties and states to implement the Safe System approach. This could be technical assistance, sharing resources, peer-to-peer learning, funding and other tools. Collaboration among different stakeholders should also be required because safety is a shared responsibility, and we will not reach our goal of zero unless everyone is working together.
Road to Zero
More states and localities have adopted “zero” language into the goals on our roadways. This language has been commonplace in other settings, like workplaces, where NSC has focused since our founding, with meaningful results. NSC also leads the Road to Zero Coalition, a diverse group of more than 1,800 organizational members committed to eliminating roadway fatalities by 2050. The coalition represents transportation organizations, businesses, academia, safety advocates and others. This is the first time so many organizations and individuals have collaborated to put forth a plan to address fatalities on our roads. To these members and to NSC, “zero” is not just a catchphrase but an attainable and necessary goal.
Through the Road to Zero Coalition, NSC has awarded millions in grants to groups across the country working in communities of all sizes. In the first year of grants, the National Complete Streets Coalition, worked with three communities: Lexington, KY, Orlando, FL, and South Bend, IN. Each city was provided only $8,000 from the grant for temporary infrastructure changes, and each city had measurable improvements to safety, even with a small-dollar investment.
Grants were recently awarded to Johns Hopkins University, Children’s Hospital of Philadelphia, Health by Design, an organization based out of Indianapolis, Indiana, Portland Bureau of Transportation, Northwest Side Housing Center, a community housing center in Chicago, IL, and a coalition out of Washington, DC including Washington Area Bicyclist Association, Howard University Transportation Research Center, and Safe Routes Partnership. These grantees are working on projects that include data visualization, education and implementation of the Safe System approach, and community engagement in traffic safety activities. Each project has an equity component incorporated into its efforts and these projects will be used to inform and guide future efforts of the Coalition and its members.
Equity
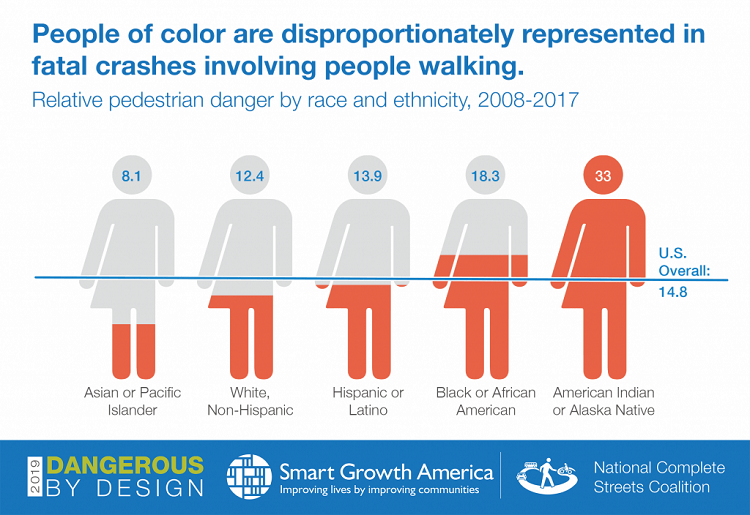
In deploying a Safe System approach or any strategy to address roadway safety, we must take into account equity concerns that we know exist within mobility. Research shows people of color suffer higher rates of pedestrian fatalities and severe injuries than their white counterparts. Also, programs and policies that aim to support safety – such as those around jaywalking – disproportionately burden communities of color. Data show people of color, older adults and low-income communities are over-represented in pedestrian fatalities and under-represented in the investments made in transportation improvements. The chart below shows American Indian or Alaskan Native people run the highest risk of being killed while walking along the roadside; other data show drivers are less likely to yield to Black people walking and biking.
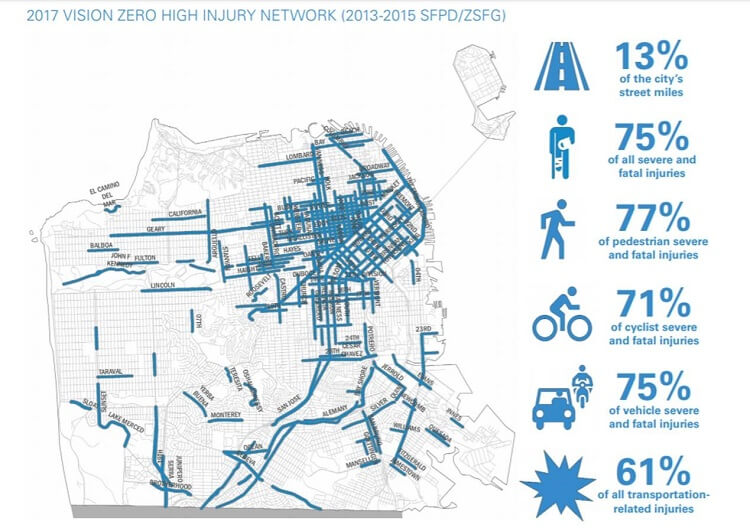
One reason these disparities exist is that not all streets are created equally. Roads in low-income communities lack basic infrastructure and safety features that are common in wealthier communities and have higher crash rates as a result. This leads to so-called high-crash corridors or high-injury networks. For example, Vision Zero SF in San Francisco, CA found 75% of the city’s severe and fatal injuries occur on just 13% of the city’s street miles (see graphic below).
Data like these are available in every community that chooses to collect it. Such information can empower policymakers, city planners and engineers to direct limited resources to the areas in greatest need of safety improvements to have the biggest impact.
Engineering is another lens through which to consider equity in transportation. NSC believes an equitable approach to engineering must consider:
● Addressing existing or historic bias, disenfranchisement or overburdening of a specific group or population in any planning or proposal considerations.
● Creating contextually sensitive plans and solutions and avoiding one-size-fits-all solutions. Changes or improvements must be context-sensitive and meet the needs and desires of the individual communities they purport to serve.
● Identifying and assessing unintended consequences that might result from well-intentioned efforts.
● Engaging community members, stakeholders and system users from the outset to ensure the solution is having the intended effect.
● Involving a diversity of people in testing and design to increase safety.
● Supporting the design of vehicle technology to improve safety outcomes for all roadway users.
● Supporting efforts to improve transportation and, ultimately, enhance access and mobility independence.
We cannot achieve our goals of safer roadways without simultaneously addressing the equity concerns and barriers to access created by them. To do so would perpetuate decades of harm and undermine our ability to create safer streets for all.
New Mobility
Whereas equity concerns must be taken into account to address past roadway decision-making, considerations on new mobility and the future of traffic safety must be taken into account to create a safer for future for all users. Later this month, NSC will release a new report outlining 10 key areas where technology, mobility of people and goods, and safety intersect in ways that will shape our transportation landscape. Throughout history, new mobility technologies have disrupted business as usual, changing the way we move people and goods. Today is not different other than the innovations are coming faster and without much time to plan from a policy standpoint. This report captures key trends that will allow decision-makers to create policies and programs that can adapt, grow, and engage technology of the future.
These trends touch on a variety of topics of interest to policymakers at the national, state, and local levels as well as leaders of business, academia, and advocacy. They include things like providing support for integration of climate and safety goals and initiatives, regulation of vehicles by size and speed, and the continued need for an emphasis on protections for vulnerable road users.
This new report will also guide future efforts of NSC in programming, communications, and strategy, but more importantly it will serve as a resource for NSC and its partners as we navigate the future of mobility. The findings offer a starting point to come together, identify areas for new collaboration and research, and advocate for safer streets in the near and long-term future.
Over the course of its 100-year history, NSC has shaped the safety landscape in workplaces, roadway, and beyond. With the release of this research and related new initiatives, NSC will provide vision of the potential safety implications coming in the future and provide solutions to navigate these problems. With the increasing fatality numbers today, we should do all we can to prevent a safety crisis tomorrow.
Conclusion
The toughest change to reducing fatalities and injuries on the roadways is the shift to truly prioritize safety by changing safety culture on the roads. We are complacent when it comes to losing so many people every day on our roads, and we must remember these are not accidents, but preventable crashes. We need strong and passionate leaders committed to changing safety culture. We have successfully done it in workplaces, around child passenger safety, smoking and in other areas. We can do it here, too, but only with your help. NSC looks forward to working with this Committee to develop these provisions fully.


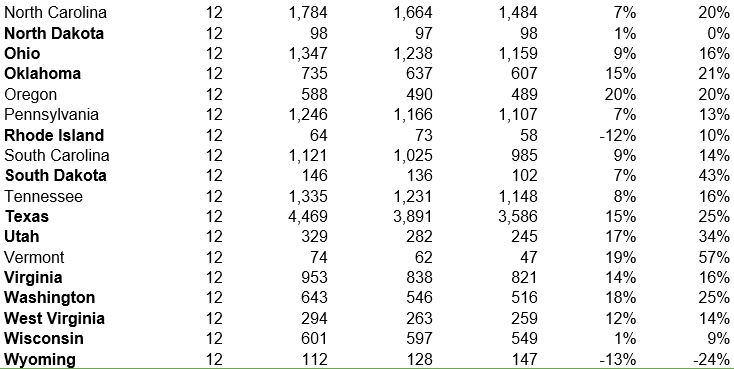
Deaths are reported by state traffic authorities. ALL FIGURES ARE PRELIMINARY. To ensure proper comparisons, 2019 and 2020 figures are preliminary figures covering the same reporting period as those for 2021. The total for 2019 is from the National Center for Health Statistics.
States in bold are states with a decrease in deaths from 2020 to 2021.
There are no items in your cart